- 8 min to read
Unwanted Research: Speed and Performance of Web Dev, SEO and Marketing Agencies Websites
We analyzed 20k agency websites for speed and performance and what we learned is not that good.
Performance. Security. Ease of scale. And the price. As a Jamstack web dev shop, we are borderline obsessed with these. At the same time, we aspire to be as fully transparent as we possibly can be by sharing good and bad, ups, and downs with all of you.
Like many great ideas (though I am not entirely sure this qualifies as a great idea) this one came during the discussion about the speed and performance of our team retreat in Palermo when Denis (our CEO) suggested we do large scale research on web dev, SEO, and marketing agencies and their website speed and performance together with underlying tech and whatnot.
Why? Well, being in the business of web development we wondered how we stand against our peers. Tech and performance vise. Not so long ago we too made the mistake of damaging brand advocacy with poor execution (read the case study). What was the case with other agencies?
Thank god for my iPhone notes since the discussion took a different path almost immediately.
What Data Were We Interested In and Why?
Lighthouse performance metrics for one. We live in a performance-obsessed world. Performance pretty much affects everything from usability and conversions to search engine appearance. Page speed is valued by users and Google values users’ behavior (we talked about it in our Jamstack SEO guide). Hell, Google even announced it will publicly shame slow-performing websites.
On top of that, performance is one of the top-selling points of Jamstack so it was only natural to take a deep dive into an industry that tackles website performance.
Wordpress or not? and if not what it is built on, for two. 35.5% of all the websites are powered by WordPress. Who are we gonna compare with than with those in the mainstream? Besides, there is an educational and marketing angle to this as well, which deserves a separate post.
With the goals set, it was time to see which tools we can use to gather the necessary data.
This can’t be that hard, right?
TL; DR: Summary of Our Key Findings
In case you don’t want to read how we did the research scroll down for result charts or check the key findings:
- 27% of websites from our 20K sample still run on http.
- 64.9% of tested websites are built with WordPress. For 19.7% we were not able to detect any CMS. 2.56% run on Squarespace, 1.56% are built with Drupal, 1.46% are on Wix, 1.19% are built with Joomla. and 1.19% with HubSpot.
- Only 5.1% of WordPress-run websites have good Lighthouse performance scores (between 75-100).
Join Bejamas newsletter
Get our EXCLUSIVE case studies, researches, tips/tricks, and free code for your website.
1️⃣Gathering Web Dev, SEO, and Marketing Agencies URLs
Data gathering has never been my strong point. Actually, I don’t mind doing it, I just hate the fact that it is so time-consuming. We are living in an API-driven world so utilizing tools such as Phantombuster (which by the way is an amazing growth hacking automation tool) first came to mind. Outsourcing came second.
I was amazed at what kind of work you could do with virtual assistants on Upwork or Fiver for a small price. All you have to do is set a goal or a list of goals and your virtual assistant would scrap the data for you.
I decided it is best to use both approaches. So, I cross-reference the results and got out of it a nice list of 20k URLs (20397 URLs to be exact).
Why 20K? Keep reading.
2️⃣Gathering Performance Metrics in Bulk for All of Them
As the latest front-end tooling survey shows most of us use Lighthouse for speed and performance results. So, for this task, the obvious choice was utilizing the Pagespeed Insights API (PSI). The other possible option we could explore was the WebPageTest as explained here.
I say WE here since we had two approaches ie a marketer looking for a solution and a dev making his own.
We started out with dev work first.
Lighthouse results obtained via PSI may differ from Lighthouse scores obtained
from local Chrome (in most cases they should be different). The difference is in
the environment where Lighthouse runs ie PSI Lighthouse runs in the cloud whereas
Chrome's Lighthouse runs on the Chrome you use.
While the PSI API gives you the ability to extract performance data as well as suggestions on how to improve the page's performance, accessibility, and SEO we were interested only in a couple of metrics we find important:
- Overall Performance Score - I think it is obvious why.
- Time to Interactive (TTI) - because it marks the point at which your website is both visually rendered and capable of reliably responding to user input.
- First Meaningful Paint (FMP) - because it influences potential user engagement,
- Estimated Input Latency (EIL) - because it measures the time you click on a button and the time something actually happens. It measures “a lag”. It measures the level of the user’s frustration. You don’t want to have everything rendered, but you click and nothing happens. Sometimes it’s better to delay the first contentful paint to optimize input latency.
Take a pause here and read Google’s extremely useful mapping metrics to user experience explanation.
Back to our task. So, Denis came up with a pretty simple function to use it in Google sheet:
However, me being the stubborn poor coding guy that I am, I let my ego take the best of me and search the web.
Now, in the SEO world, we often have the need to check the best-performing pages to look for tech clues that we might enhance. And checking performance page by page is a tedious task.
Guess what is the solution to make it faster? Google Sheets and Pagespeed Insights API of course.
Props to James McNulty from UpBuild for the best solution I've found and used in this research.
To make sure the results are accurate I decided to run a performance script 3 times for each URL and use an average value.
Getting The Results Problems
Setting the above script to work wasn’t hard. What was hard however is making it work within a reasonable time. We used Google Apps Script to fetch data and add it to our Google Sheet. The problem is Google Apps Scripts have a six-minute execution time limit for personal accounts whether you push it manually or schedule it. Within those six minutes, I was able to get results for 30-40 URLs.
You do the math for 20k websites. That was not acceptable.
Luckily if you just copy/paste the function in each cell it can work with up to 200URLs simultaneously (found it out via old proven trial and error method).
Furthermore, I’ve divided URLs into a couple of files with each having around 3k URLs to make work easier/faster. Even so, the Log option, which takes and stores results, did not work properly I guess because of the number of URLs. So the only way to do it was to copy all the data and paste values only in another sheet.
Sheet Problems
Before we started we’ve set all URLs were with HTTPS protocol. Why? Google is pushing for it and it is already an essential part of website SEO. This, however, caused problems for our script.
If the website did not run on HTTPS, the script would return results as #ERROR, and that screwed calculations of the average result. Running a filter that would exclude #ERROR and 0% results helped.
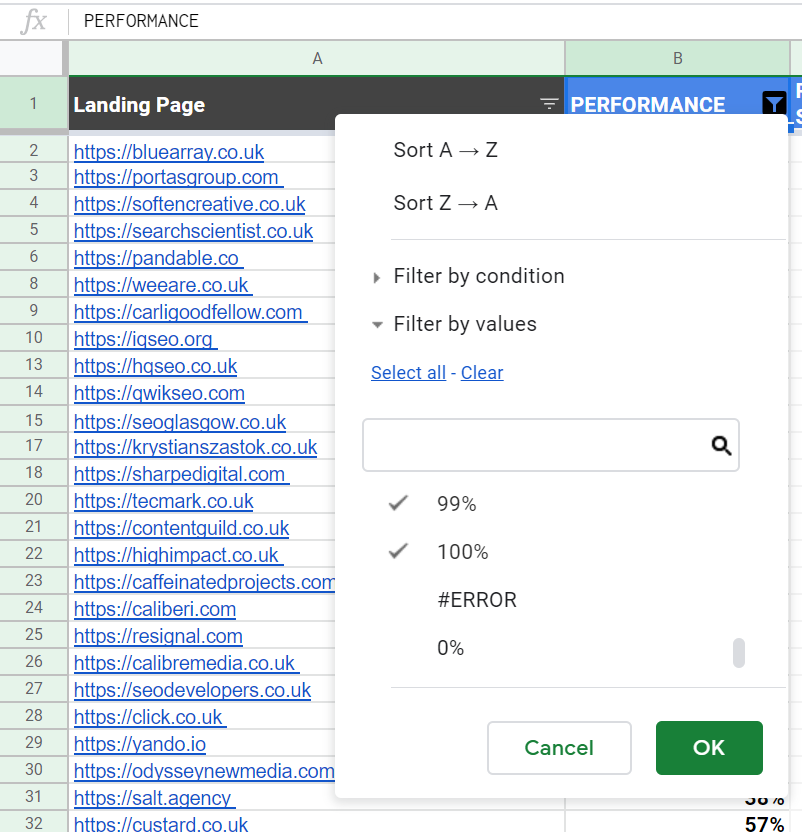
The other problem that I have had is that sometimes I would get a blank cell instead of a result for individual metrics. Two theories: aliens 👽or a weird byproduct of running too many functions. Be as it may the solution was to add 0 to blank cells.
So, I ended up having results for 14776 URLs instead of 20K. This means 27% of websites from our 20K sample still run on http. And I’m talking about web dev, SEO, and marketing agencies websites that really should know better than that. Not good.
3️⃣Gathering Site Build Data ie Wordpress or Not
The final stage of our research was finding out which website is running on WordPress and what version if possible. It would be awesome if we could find out what else is used if not WP but that wasn’t mandatory.
Again, Denis set a simple function that utilizes data fetched with PSI API.
It would return results as Yes/No Wordpress and that was not enough for me. Finding results for individual results is easy. Having results on massive scales is something else. I turned to my old pals at PhantomBuster and they have an option that might do the trick. However, I’ve already broken all the deadlines and needed something fast.
Sure I could use BuiltWith for it. But the price of $694 for 20k credits or $495 monthly for the pro plan was not an option. Besides I had my eye already set on a new service WhatCMS. I tested the results out with a free plan. Played a bit with results output and that was it.
Research Limitations. In case you’ve read the post so far you are certainly
aware of the possible limitations. YES! The quality of data depends much on
the methods and tools we used. Still, I think this gives a nice overview of the
industry that should lead when it comes to speed and performance.
The Results
Pie charts are the best way to visualize the collected data. I will not interpret the data. Nope, I won’t fall into that trap. I’ll let you discuss it anywhere you want to and have you invite me to the discussion by dropping a DM on my Twitter acc here.
Most used CMSs
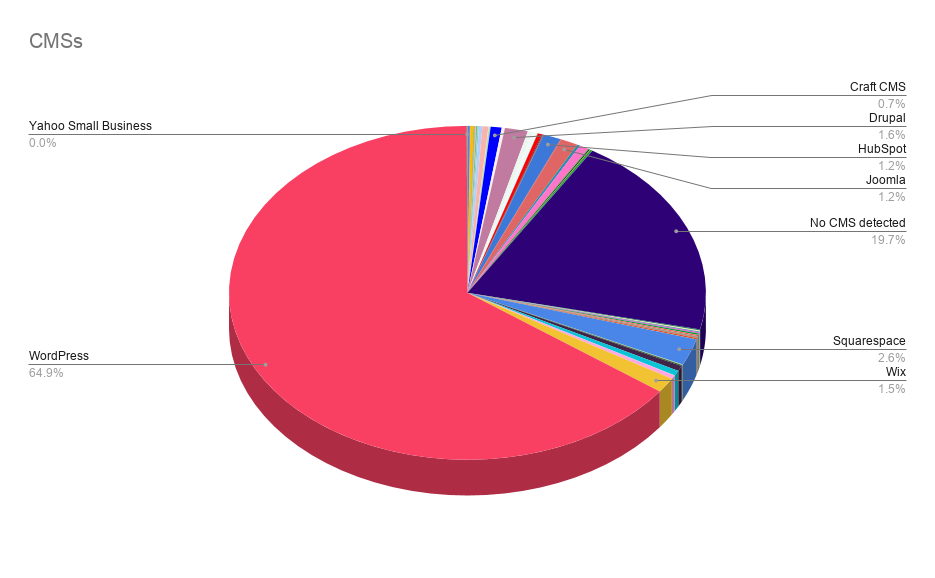
While WordPress globally rules the CMS space with 60.8% of the market share our research shows 64.9% in favor of WordPress when our sample of web dev, SEO, and marketing agencies websites is concerned.
Performance Scores
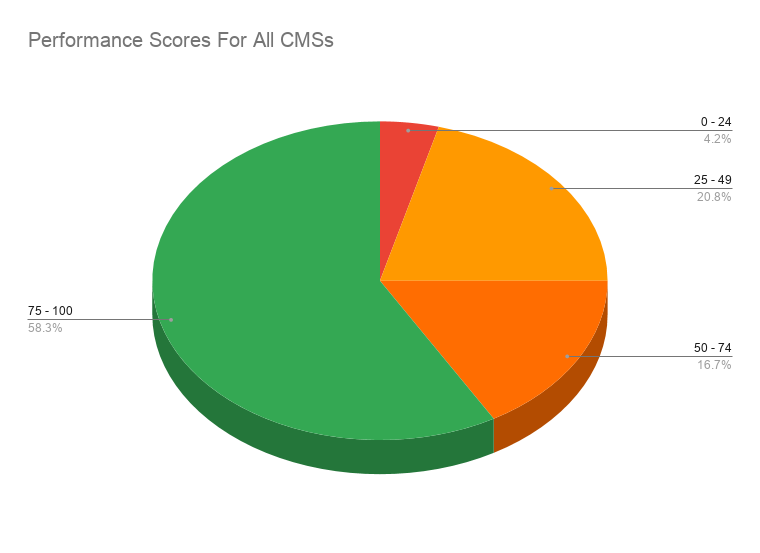
More than half of the URLs we’ve checked have a good performance score. However, only when you take the below chart into consideration you’ll have a clearer picture of performances and underlying tech.
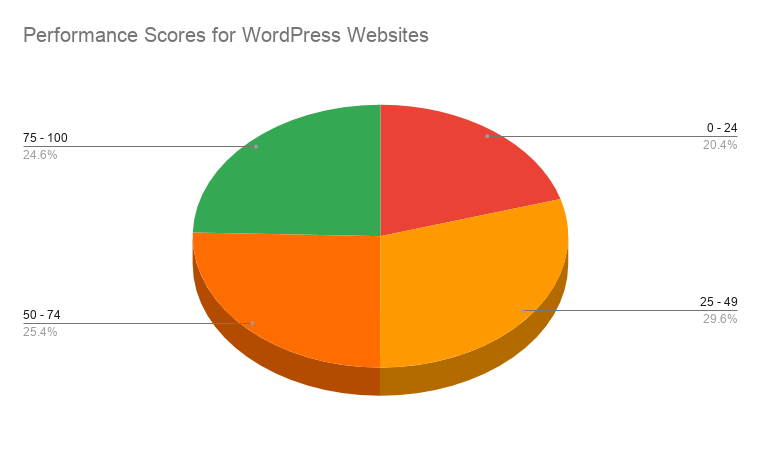
Performance score vise 79.3% of WordPress run websites have a poor or slightly above poor Lighthouse performance score ie 0-50. Only 5.1% of WordPress run websites have good performance scores ie 75-100.
Time to Interactive (in seconds)
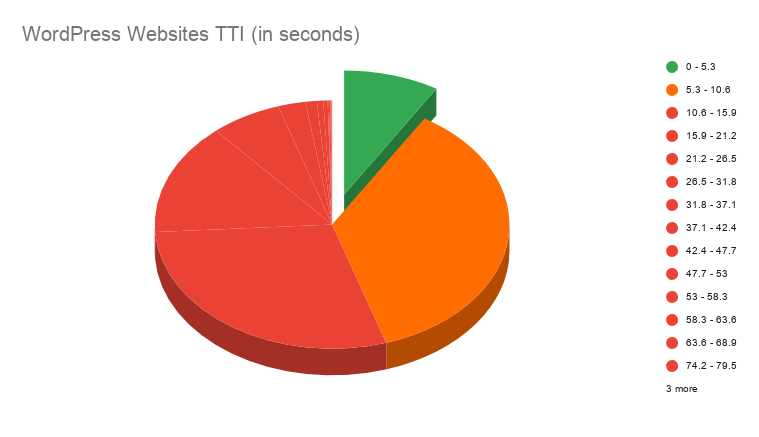
8.71% (826 websites) of tested WordPress websites have fast TTI score 0–5.2s. 3446 websites have moderate TTI scores and the rest are just no good.
What Now?
The general ‘feel’ is that the ones that are required to think of speed and performance failed our test. However, being that we’ve tested only 20k URLs let’s not generalize conclusions. Besides, performance, while it matters for many reasons, is not and should not be the end goal. It depends not only on the tech used but also ‘features' you’ll have on a website which pretty much depends on the industry/theme your website is in.
Thing is, whatever tech you use you can end up with good scores (some easier than others). The real question is how important are the scores for your client, their audience, and their business?
The next stop for us is to do something similar with Jamstack websites. In this one, we've had only 40 websites recognizably made with Gatsby (that's 0.27%) and a few more with a couple of Jamstack related tools (not all necessary being made in the Jamstack way).
Have a project at hand that is perfect for Jamstack performance benefits? We can help in that regard.
CLICK HERE to schedule a 1-on-1 talk and learn more about what we can do for you, your audience, and your business.
Further Reading
As always with our posts, I’ve got links to share for further reading. If you are interested in the subject of speed and performance I’ve found the following articles useful and fun to read during this research:User-centric Performance Metrics - https://developers.google.com/web/fundamentals/performance/user-centric-performance-metricsMetrics typically used to measure page speed and Largest Contentful Paint (LCP)- https://www.onely.com/blog/largest-contentful-paint/Google PageSpeed Insights: The Truth About Scoring 100/100 - https://kinsta.com/blog/google-pagespeed-insights/Building the most inaccessible site possible with a perfect Lighthouse score - https://www.matuzo.at/blog/building-the-most-inaccessible-site-possible-with-a-perfect-lighthouse-score/Who has the fastest website in F1? - https://jakearchibald.com/2019/f1-perf/Page Speed Benchmarks - https://speedcurve.com/benchmarks/CMS market share: November 2019 analysis - https://joost.blog/cms-market-share-november-2019-analysis/How We Achieved A Google Page Speed Score of 100 With WordPress - https://nickleroy.com/blog-posts/wordpress-site-speed/Every Web Performance Test Tool - https://www.swyx.io/writing/webperf-tests/